Welcome to My Portfolio
Explore my projects, writings and other things.
Projects
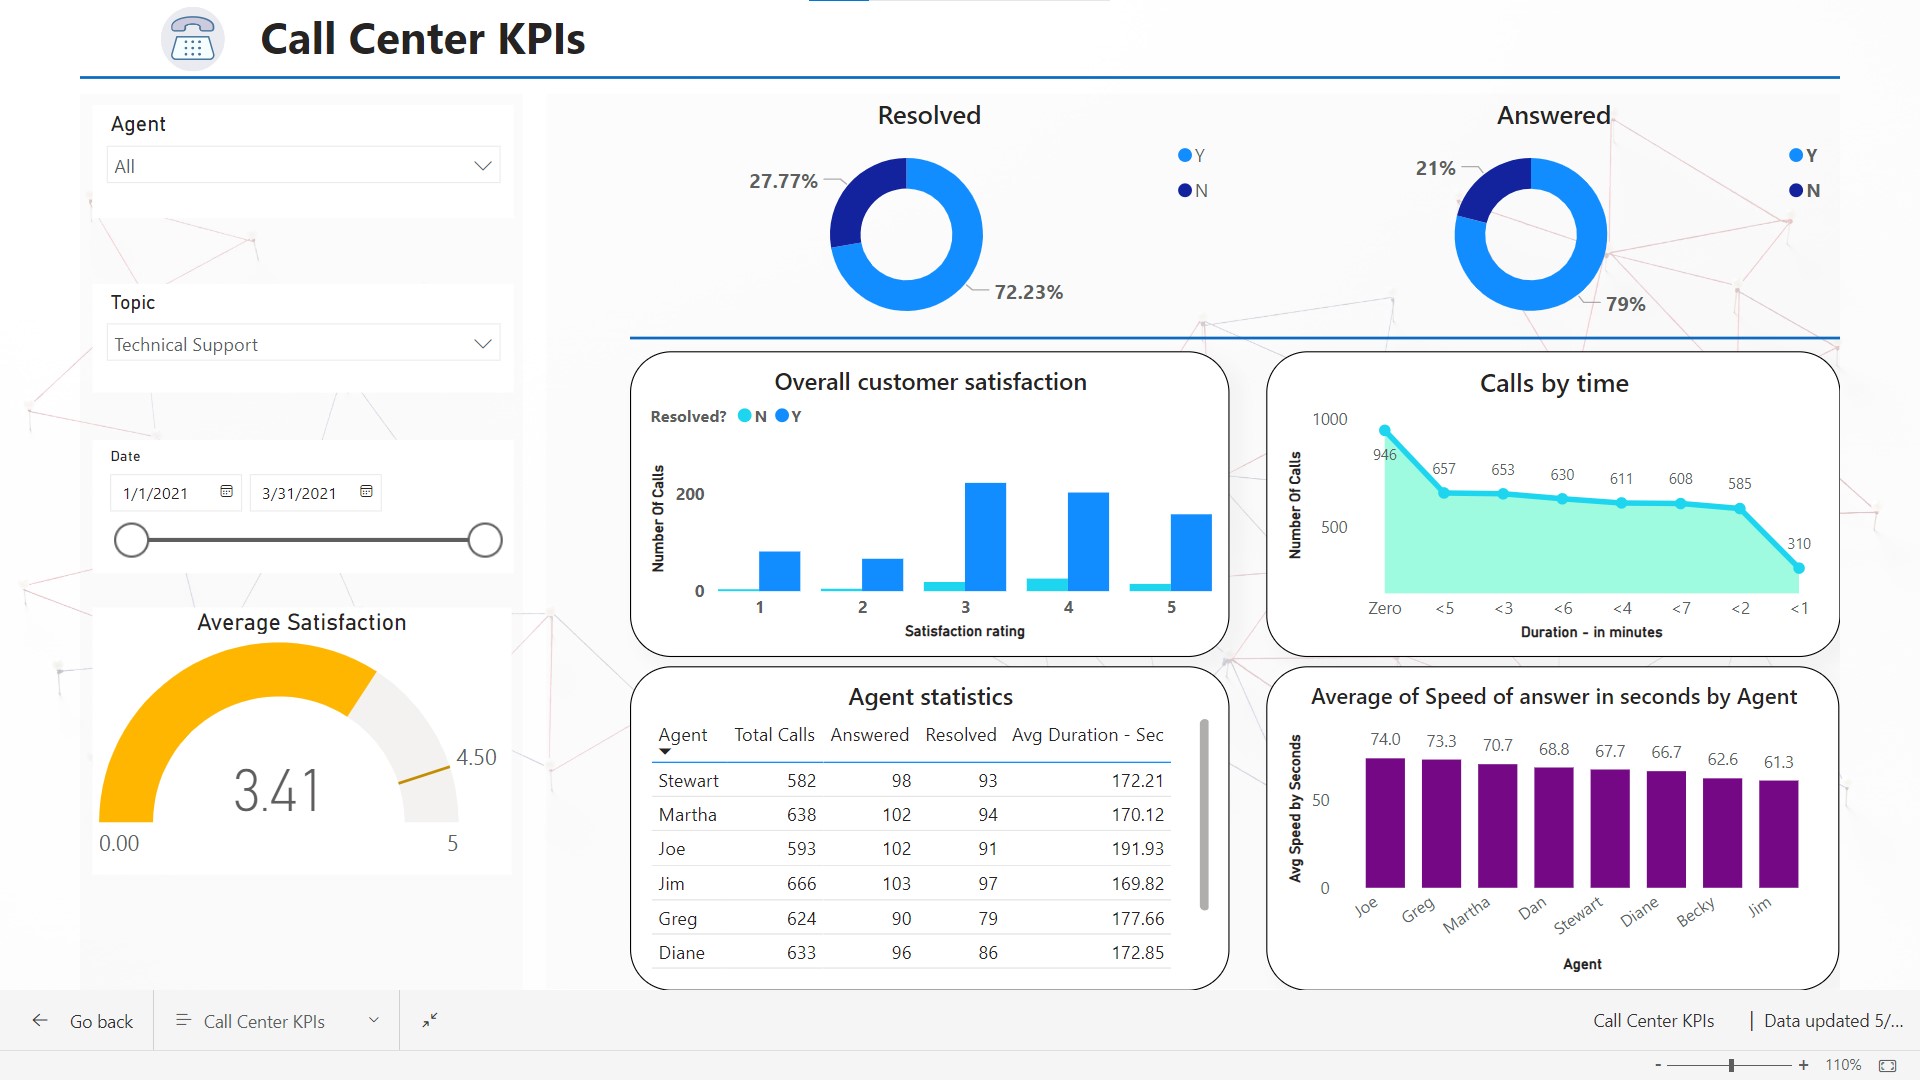
Call Center Dashboard
Created a Power BI dashboard to illustrate key KPIs: customer satisfaction, call metrics, average speed of answer, and agent performance.
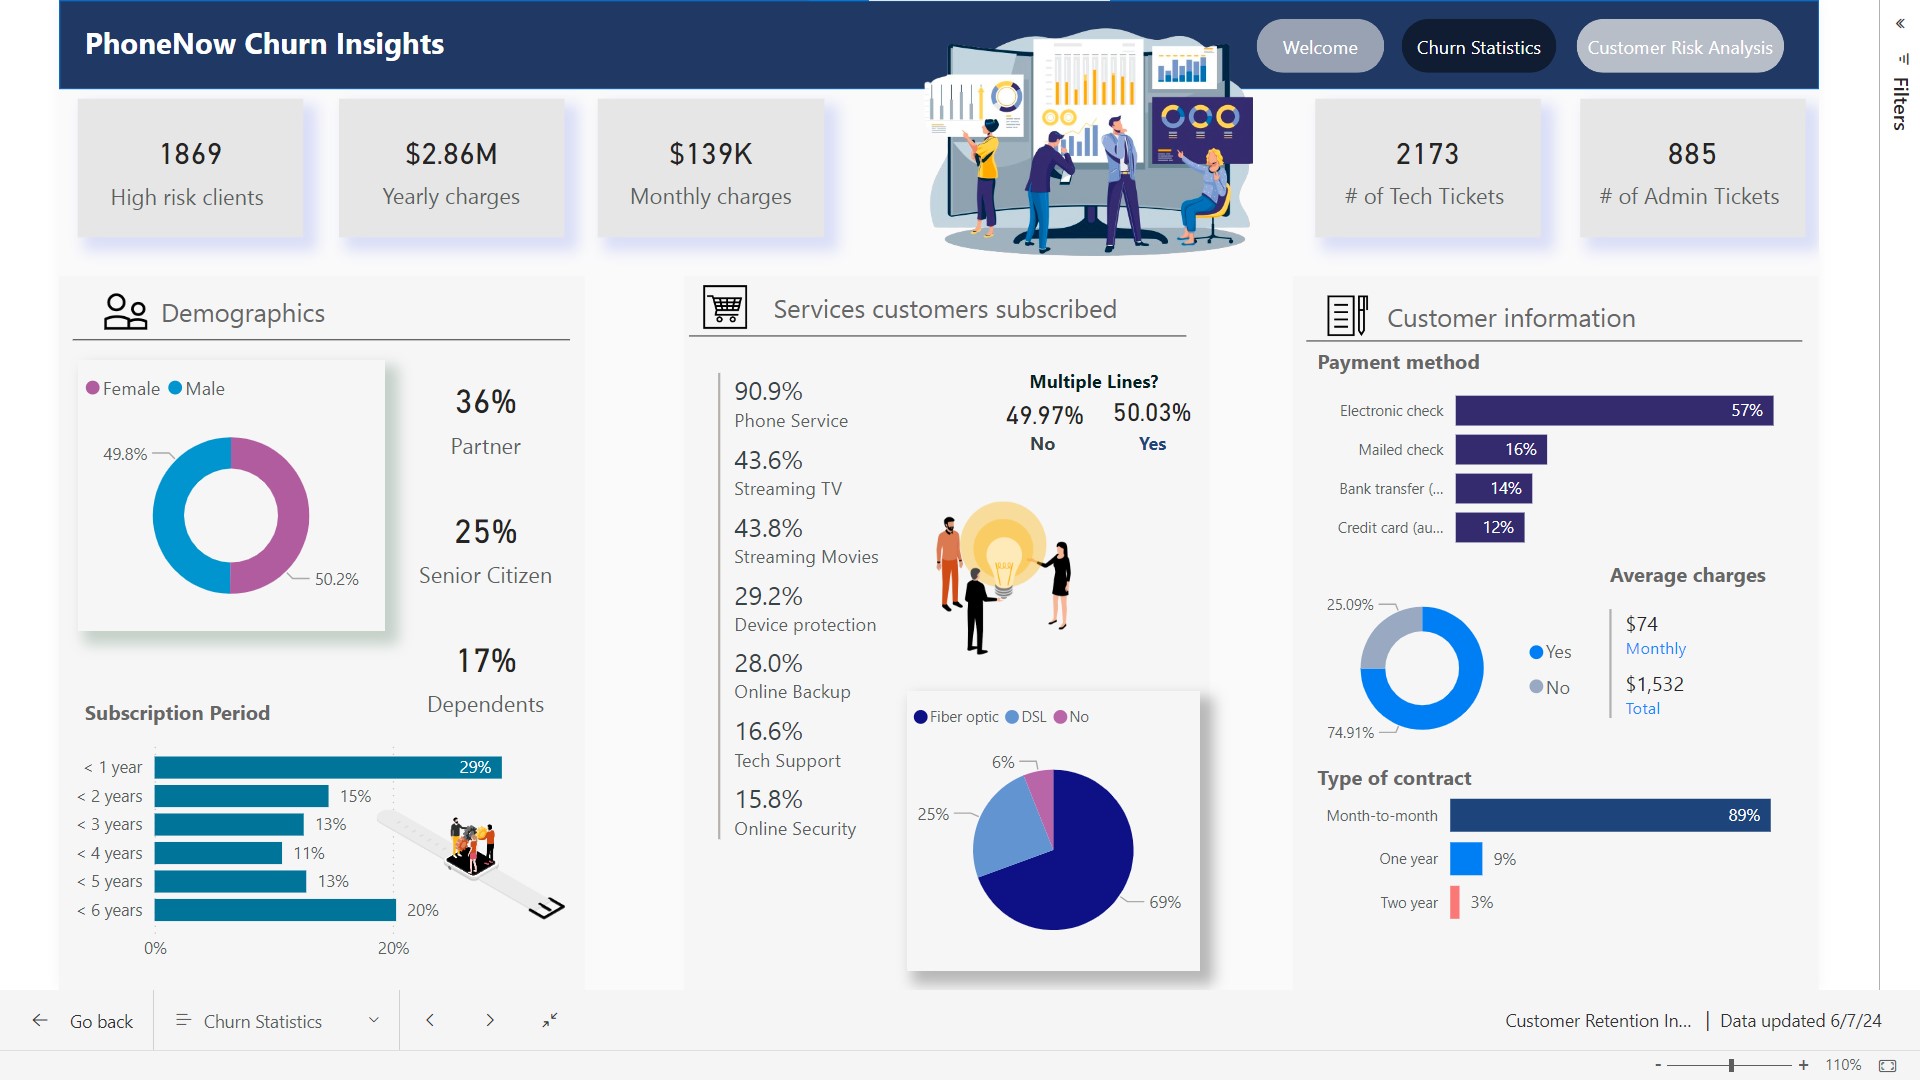
Customer Risk Analysis
Defined relevant KPIs for retention management, and developed visualizations for the retention manager, focusing on these KPIs. also I ensured the dashboard effectively reflects the defined KPIs to aid decision-making.
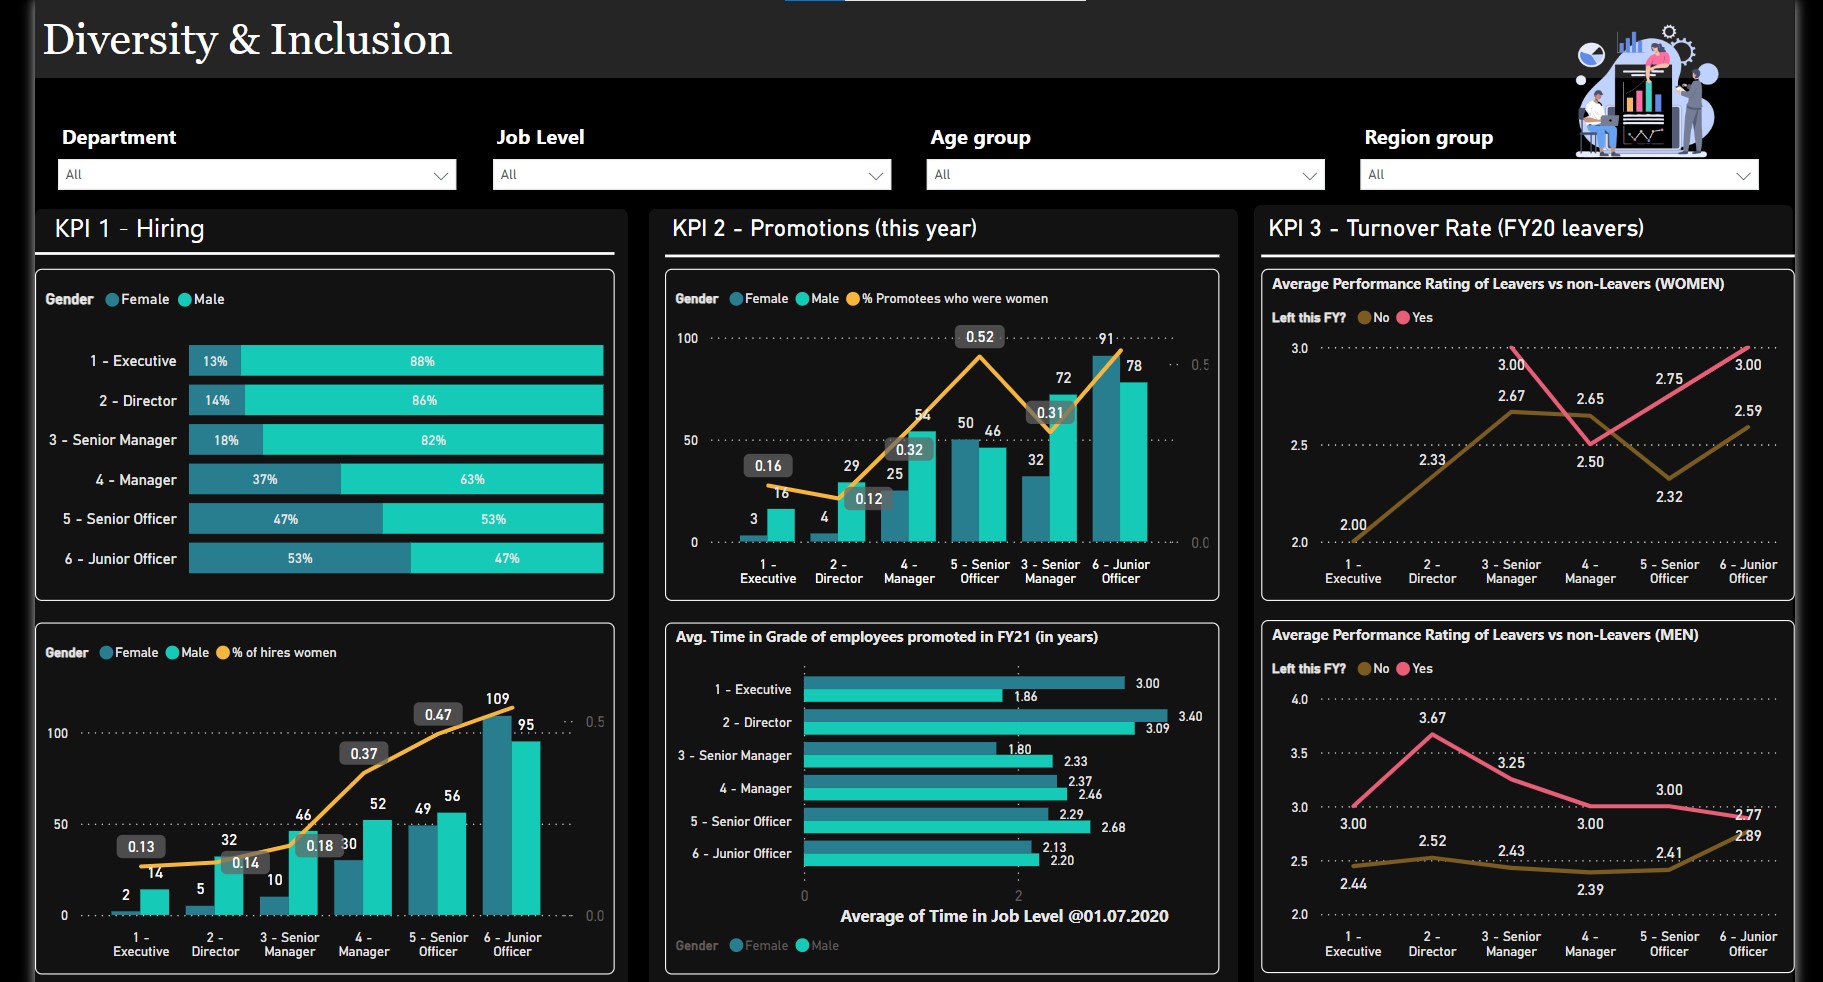
Diversity and Inclusion Dashboard (HR)
Created visualizations to represent HR data, particularly focusing on gender-related KPIs, and identified and discussed potential root causes for the slow progress in achieving gender balance at the executive management level.
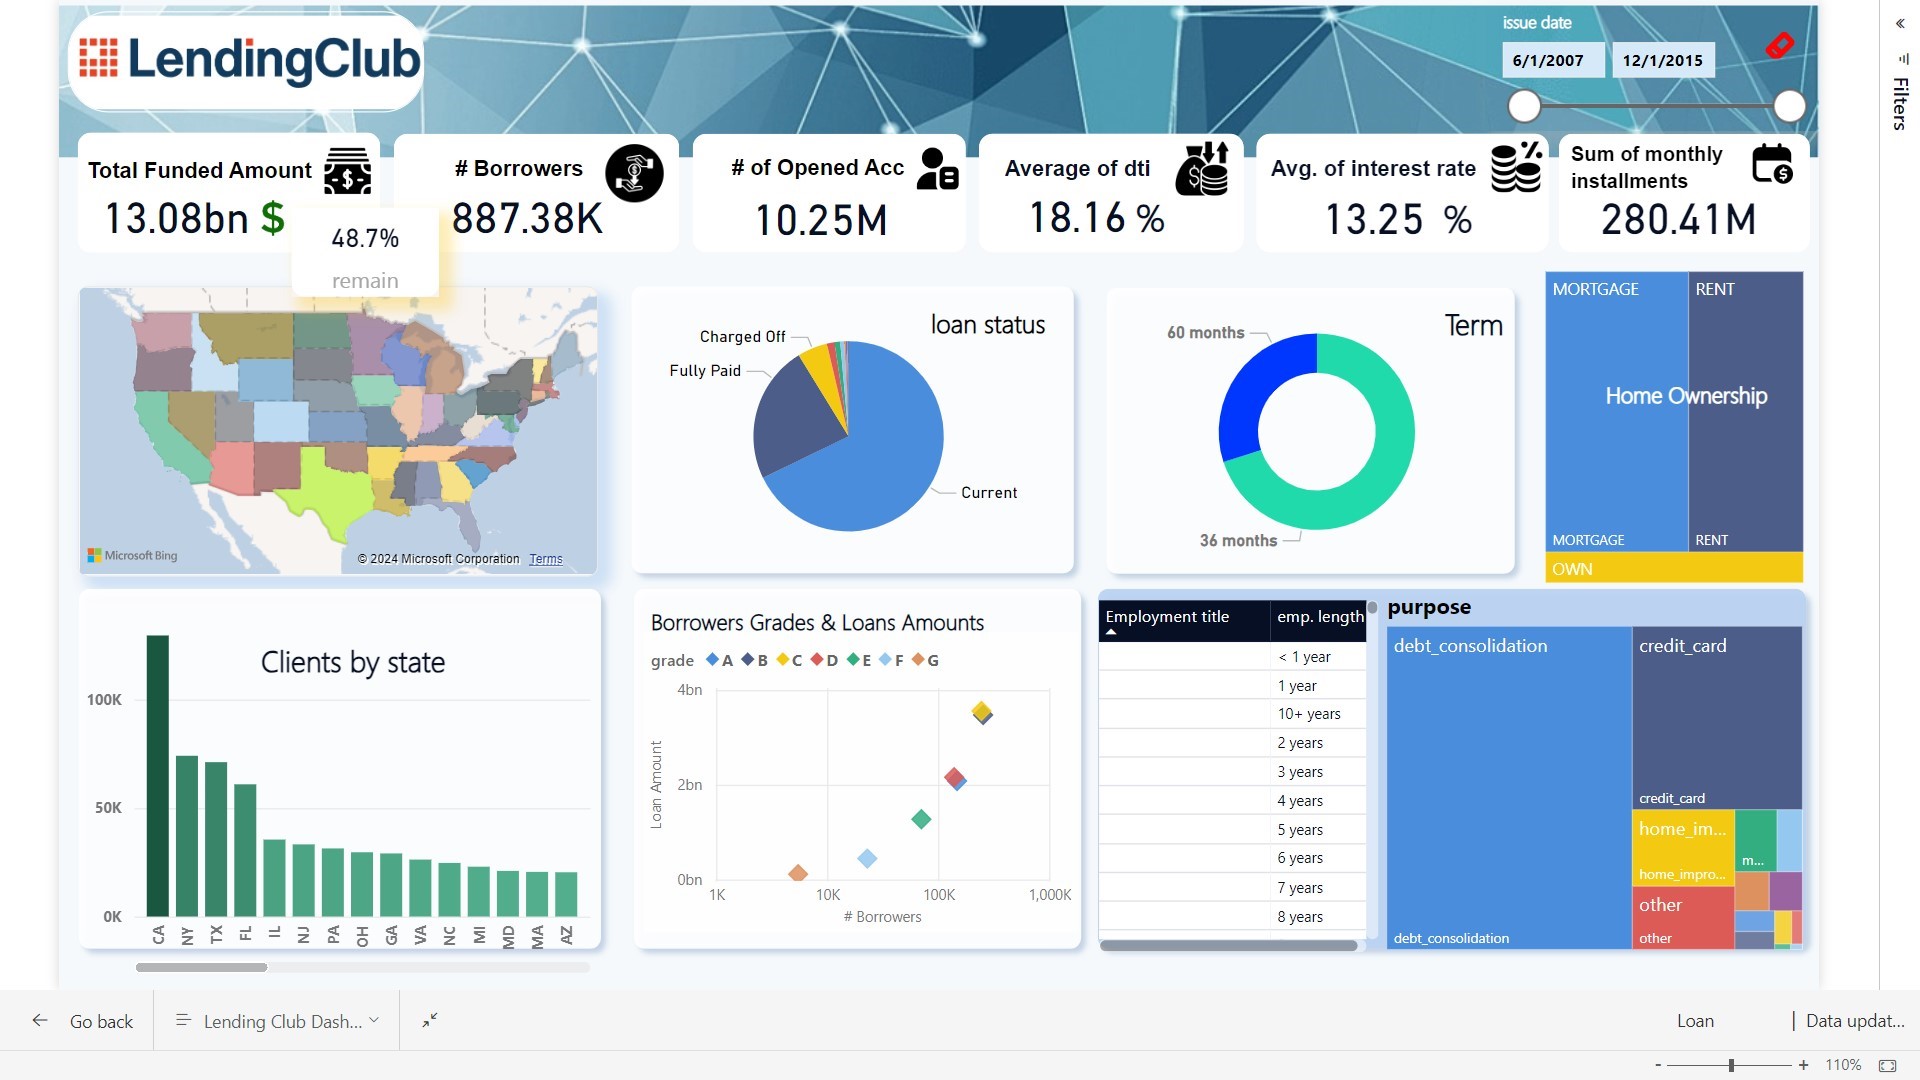
Lending Club Dashboard
prepared and cleansed the data from the Lending Club company's database, ensuring its accuracy and readiness for analysis. I identified and incorporated the essential insights that the dashboard needed to provide. Additionally, I created the necessary measures, selected the most appropriate visuals, and developed the Power BI dashboard accordingly.